Introduction
During the regular season a common measure of a teams remaining strength of schedule (SOS) is the combined winning percentage of the opponents yet to come (More Information ). A high winning percentage implies the teams you still have to face are probably tough and vice-versa.
There are two ideas I want to apply in this work:
- Substitute the winning percentage with a more adequate measure of team strength: the Elo score.
- Instead of a prospective SOS, calculate a retrospective SOS.
The first addition is self explanatory and through 538s great work very easy to implement. The latter idea stems from my interest in questions like
- Who had the hardest or easiest season in 2019?
- Who had the hardest playoff run ever?
- Are there differences between the conferences?
- Who had the luckiest season ever? (in terms of opponent strength)
The goal of this work is not an improved SOS-Value but a statistical glimpse at variation in opponents strength throughout the last four decades of the NBA.
Data
- Scope: All games since the 1976-77 season (NBA/ABA Merger) until the 2018-2019 season.
- Source: 538s Elo database
What about the variation?
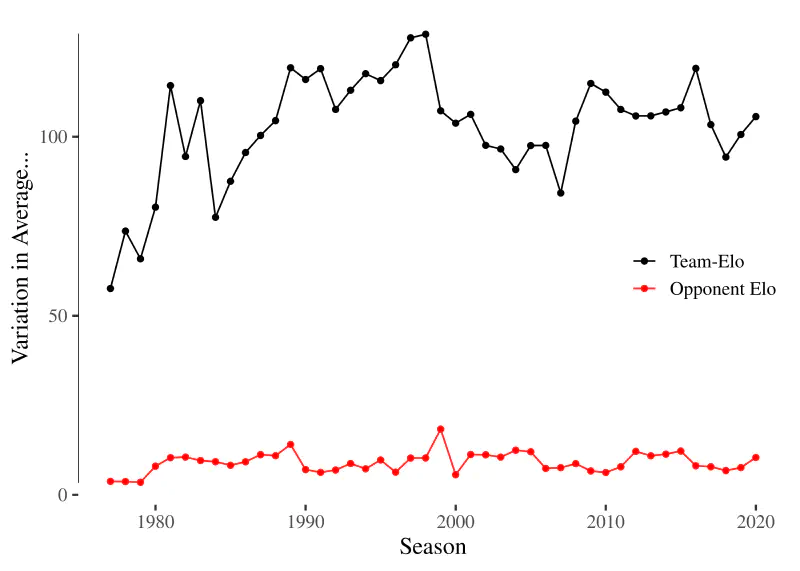
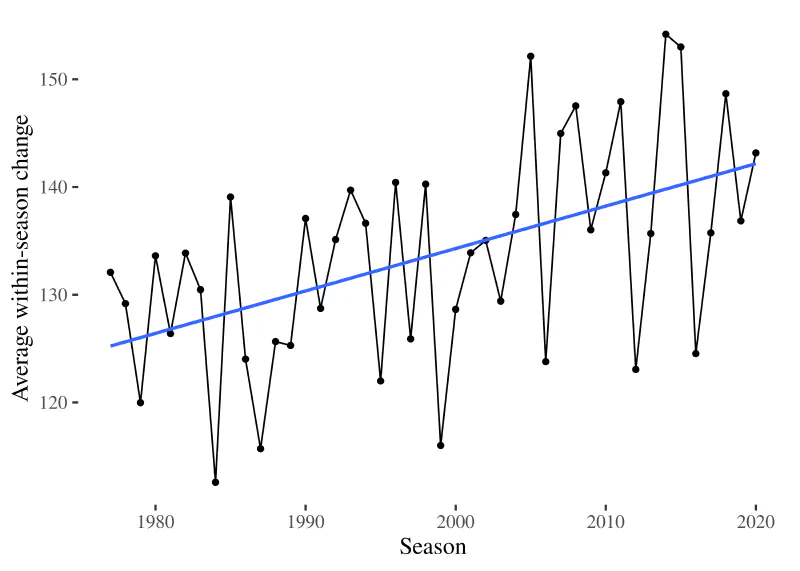
One important assumption that I make is that the variation in opponents strength - measured through the Elo rating - actually contains meaningful information and not just random noise. As you can see in the graphic below, the variation in opponents strength is around one order of magnitude smaller than the variation in team strength. Intuitively this makes sense: differences between teams are much more pronounced than differences within a team.
What reasons could there be for this small variaton in oppoElo-Scores? I can think of two major and one minor source:
- Conferences: If your conference is weaker on average, then you will play more games against weaker opponents and your oppoElo will be lower.
- Intra-Season Changes: Imagine two teams playing the same opponent; one matchup at the beginning of the season, the other at the end. If the opponent improves steadily throughout the seaon, the second matchup will be harder then the first. (Provided, of course, that the Elo rating accurately reflects the change in performance.)
- Your own team strength: This is in a similar vein as the conferences. If you are a strong team, meaning you win a lot of games, the increasing difference between your high Elo rating and your opponents low Elo rating will increase the variation.
In the following sections I will analyze - visually and numerically - the first two sources.
Conferences
Today it is well known, that the West is tougher than the East. Does this also manifest in the oppoElo-Scores? The following visualization shows the distribution of the last 43 seasons per NBA team in terms of Opponent Strength (1170 values total). The West does provide a harder season on average, but it also has a much bigger spread.
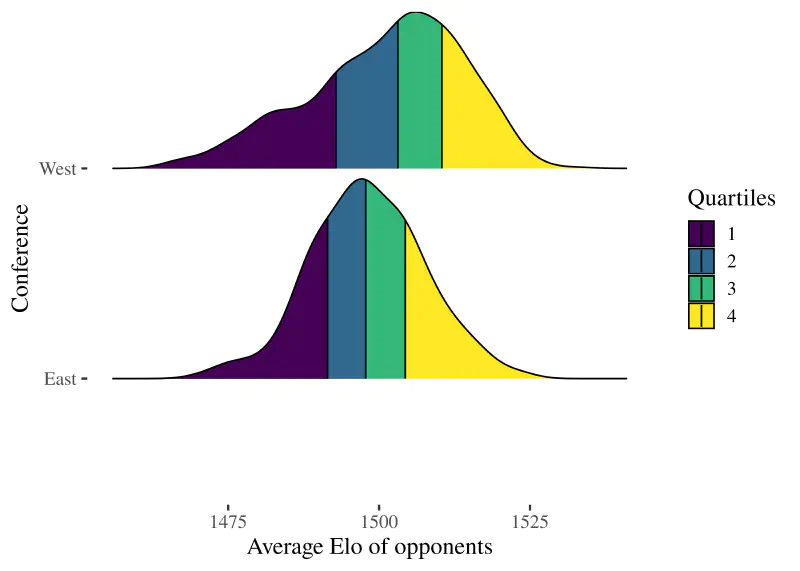
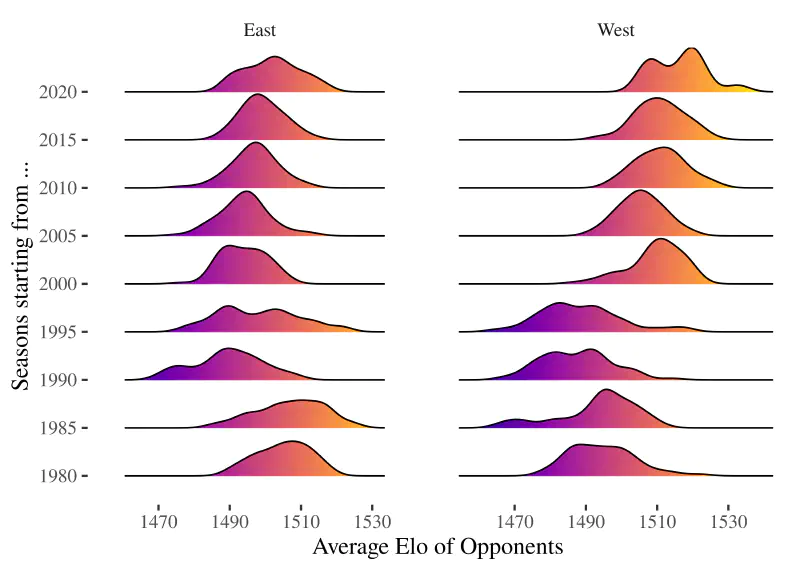
There is even a trend over time. In the 1980s, the East was actually a tougher task then the West; by an Elo-Rating of 12.1. In the current decade the tables have turned, and an average season in the West is harder by 12.8. To put these rather small numbers into perspective: it would correspond to facing the Cavs (1345) rather than the Bulls (1333).
Intra-Season Changes
So the common sentiment about conference strength is reflected in the oppoElo-scores, even though the differences are small. What about changes throughout a season. Do real life events match up with Elo developments? And how much does an NBA teams performance vary during a season?
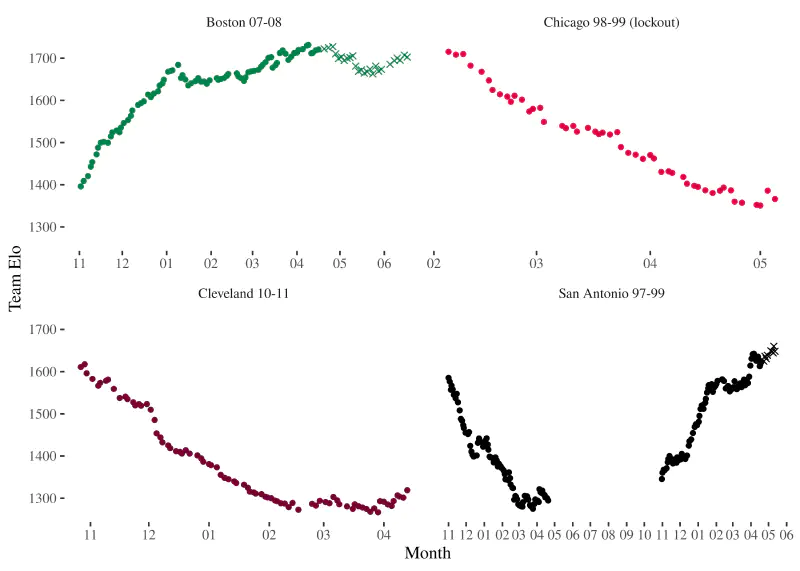
The following table shows the five teams with the biggest Elo Rating change in one single season.
| Team | Season | Difference in Elo | Highest Elo | Lowest Elo |
|---|---|---|---|---|
| CHI | 1998-1999 | 365 | 1715 | 1351 |
| CLE | 2010-2011 | 351 | 1618 | 1266 |
| BOS | 2007-2008 | 335 | 1731 | 1396 |
| GSW | 2019-2020 | 322 | 1635 | 1312 |
| SAS | 1997-1998 | 315 | 1660 | 1346 |
All of these extreme seasons can be easily exlained:
- Chicago deteriorating after Michael Jordans second retirement
- Cleveland in free-fall after Lebrons Decision to join Miami
- Boston improving drastically and winning it all after adding Pierce, Allen & Garnett
- SAS loosing all skill in 1997 just to draft future Hall-of-Famer Tim Duncan and thereby eclipsing their previous success in 1998.
On the other side of this coin, we have teams that had very little change throught the a single season. The following table shows the five teams with the least intra-seasonal change (this is not really interesting).
| Team | Season | Difference in Elo | Highest Elo | Lowest Elo |
|---|---|---|---|---|
| LAL | 2011-2012 | 44 | 1618 | 1574 |
| DEN | 1998-1999 | 44 | 1315 | 1271 |
| HOU | 1988-1989 | 52 | 1539 | 1488 |
| PHO | 1981-1982 | 52 | 1586 | 1534 |
| CHO | 2004-2005 | 57 | 1306 | 1249 |
Looking at the average team-changes over time, we can see that the transformation a team undergoes throught one single season - in terms of Elo rating - is slowly increasing. In the 1980s it was 127, now it is around 140. Ignoring any real-life scheduling contraints, bad luck could make you face a team at its best (Mavs, 1450) instead of at its worst (Suns, 1306).
2012 East: One Special Season
Interestingly, intra-seasonal changes are much higher than differences between conferences. What happens if we take this concept of scheduling-luck to the extreme. Which season had the biggest spread of luck and bad luck and how exactly did it manifest?
I present: the Eastern Conference of the 2011-2012 lockout-shortened season and Miami Heat and Chicago Bulls.
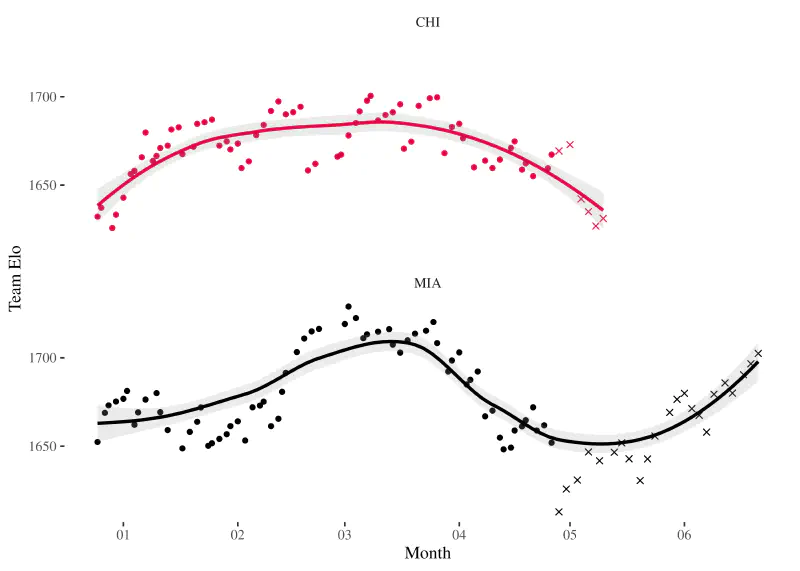
Both teams led the East both in Elo rating and wins. Miami had just lost the NBA finals against Dirk and were looking to finally deliver one of the many Rings promised by LeBron. Chicago, with reigning MVP Derrick Rose, clinched the first-seed but eventually lost in the first-round of playoffs due to injuries of both Joakim Noah and Rose.
In terms of average Team-Elo through the 66 regular season games, both teams were only separated by 8 points (Chicago: 1673; Miami: 1681). However, their average opponents Elo deviated by 23 points; an unusually high margin given their similar strength.
Chicago, appropriate for their strength had the lowest oppo-Elo average in the conference (1481); Miami, on the other hand, had the toughest schedule in the East (1504).
The following table shows the difference in opponent strength between Miami and Chicago for all matchups that season (e.g. CHO2 corresponds to the second match against Charlotte). Three matchups stand out, in which Miami had to face a much stronger version than Chicago (CHO2, DAL1, CLE3).
In total, the summed difference between both teams is 776 Elo points in favour of Chicago.
| Matchup | Elo difference (MIA-CHI) |
|---|---|
| CHO2 | 120.04 |
| DAL1 | 117.02 |
| CLE3 | 106.12 |
| DEN1 | 85.47 |
| CHO1 | 70.65 |
| POR1 | 67.65 |
| BOS3 | 61.10 |
| WAS3 | 58.33 |
| PHO1 | 57.77 |
| NJN3 | 56.11 |
| WAS2 | 42.82 |
| NOP1 | 42.11 |
| BOS1 | 36.50 |
| TOR3 | 28.94 |
| BOS4 | 26.99 |
| NYK2 | 26.44 |
| ATL3 | 25.53 |
| PHI2 | 24.54 |
| TOR1 | 24.03 |
| MIL3 | 22.78 |
| OPO1 | 17.96 |
| LAC1 | 17.46 |
| CLE2 | 16.42 |
| TOR2 | 16.25 |
| NJN2 | 16.09 |
| PHI1 | 15.33 |
| ORL2 | 15.09 |
| NYK3 | 13.80 |
| DET3 | 10.56 |
| OPO3 | 9.60 |
| LAL1 | 8.59 |
| DET2 | 8.41 |
| CHO3 | 8.39 |
| BOS2 | 8.26 |
| PHI3 | 6.93 |
| MIL2 | 1.41 |
| NYK1 | -0.21 |
| ATL2 | -0.24 |
| ORL3 | -1.25 |
| OPO4 | -2.36 |
| HOU1 | -3.22 |
| ATL4 | -3.52 |
| MEM1 | -4.35 |
| UTA1 | -12.34 |
| IND2 | -12.53 |
| NJN1 | -13.14 |
| OPO2 | -16.26 |
| ATL1 | -19.09 |
| CLE1 | -19.33 |
| GSW1 | -23.11 |
| MIL1 | -26.73 |
| IND1 | -29.05 |
| OKC1 | -31.46 |
| WAS1 | -32.61 |
| IND3 | -33.36 |
| MIN1 | -38.51 |
| SAS1 | -42.50 |
| ORL1 | -47.65 |
| SAC1 | -51.47 |
| DET1 | -51.66 |
Season Records
Now that we know causes of variation in oppoElo are linked to real-life developments, let us look at the records for seasons and playoffs in terms of opponent strength. The latter prooves to be a much more interesting endeavour because the length of the regular season averages out any extremes.
Regular Season
The 2012 Phoenix had the hardest regular season; they were actually an average strength NBA team in that season but could not fight through the ever-tough West to reach the playoffs. The 1999 Rockets had the easiest season but made a quick first-round-exit thanks to the Lakers. Even those two extreme seasons were only separated by an Elo-Score of 62.33; which is the difference between the current Mavs (1450) and Hawks (1389).
| Season | Team | Avg oppoElo | Playoffs? | Conference | Team strength during season |
|---|---|---|---|---|---|
| 2020 | NOP | 1532.65 | No | West | -0.87 |
| 2012 | PHO | 1526.57 | No | West | -0.30 |
| 2015 | MIN | 1526.56 | No | West | -1.60 |
| 2013 | PHO | 1526.12 | No | West | -1.01 |
| 2014 | MIN | 1524.69 | No | West | -0.05 |
| Season | Team | Avg oppoElo | Playoffs? | Conference | Team strength during season |
|---|---|---|---|---|---|
| 1999 | HOU | 1464.24 | Yes | West | 0.31 |
| 1989 | UTA | 1465.77 | Yes | West | 0.83 |
| 1990 | PHO | 1467.00 | Yes | West | 1.32 |
| 1989 | DEN | 1467.04 | Yes | West | 0.47 |
| 1999 | MIN | 1467.41 | Yes | West | 0.27 |
| Note: Team strength is the standardized average Team-Elo value. E.g 1 meaning the team was one standard deviation stronger than an average team in their conference. |
Playoffs
To exclude outliers only deep playoff runs ending in the finals will be considered in the following analysis. For customized tables use the Shiny-App.
The 2010 Celtics had the hardest playoff run ever. Through 24 games their average opponent Elo was 1683 which would correspond to the current Raptors (1673). Their path to the NBA finals - as a four-seed - looked like this:
- First Round: A sweep of DWades Miami Heat
- Second Round: A six-game series against LeBrons Cavs
- ECF: Another six games against the Magic lead by Peak Dwight
- Finals: Bested in a seven game series by Kobe & Paus Lakers
| Season | Team | Avg oppoElo | #Games | Conference | Team strength during season |
|---|---|---|---|---|---|
| 2010 | BOS | 1683.72 | 24 | East | 1.13 |
| 2008 | LAL | 1673.55 | 21 | West | 0.77 |
| 2009 | ORL | 1672.41 | 24 | East | 1.44 |
| 2016 | GSW | 1671.43 | 24 | West | 2.04 |
| 1982 | PHI | 1669.90 | 21 | East | 1.31 |
On the other side are the 1987 Lakers, led by Magic Johnson, with the smoothest championship run: 18 Games against the equivalent of this seasons Spurs (1563).
| Season | Team | Avg oppoElo | #Games | Conference | Team strength during season |
|---|---|---|---|---|---|
| 1987 | LAL | 1552.49 | 18 | West | 1.94 |
| 1978 | SEA | 1564.10 | 22 | West | -0.52 |
| 1991 | CHI | 1568.90 | 17 | East | 1.67 |
| 1984 | LAL | 1574.68 | 21 | West | 1.59 |
| 1999 | SAS | 1579.11 | 17 | West | 1.14 |