Why Does Frankfurt Feel So Rainy?
I moved to Frankfurt in 2023. Before that I’d spent six years in Leipzig. Within weeks of arriving I was convinced: this city is absurdly, unreasonably wet. It rained constantly. Grey skies, wet sidewalks — for the first time in a long time I needed a proper rain jacket. I started telling people Frankfurt was one of the rainiest cities in Germany.
I was wrong.
The ranking
I downloaded daily precipitation data from the DWD (Deutscher Wetterdienst) for 34 of Germany’s biggest cities, all from stations within city limits. The metric is simple: how many days per year does it rain at least 1mm? Averaged over 1991–2024.
Frankfurt sits at 110.7 rain days per year. That’s rank 25 out of 34 — firmly in the bottom third. Less rain than Hamburg, Köln, München, Düsseldorf, Bremen, Kiel. Dramatically less than the Ruhrgebiet, where Wuppertal clocks in at 151 days and Essen at 141.
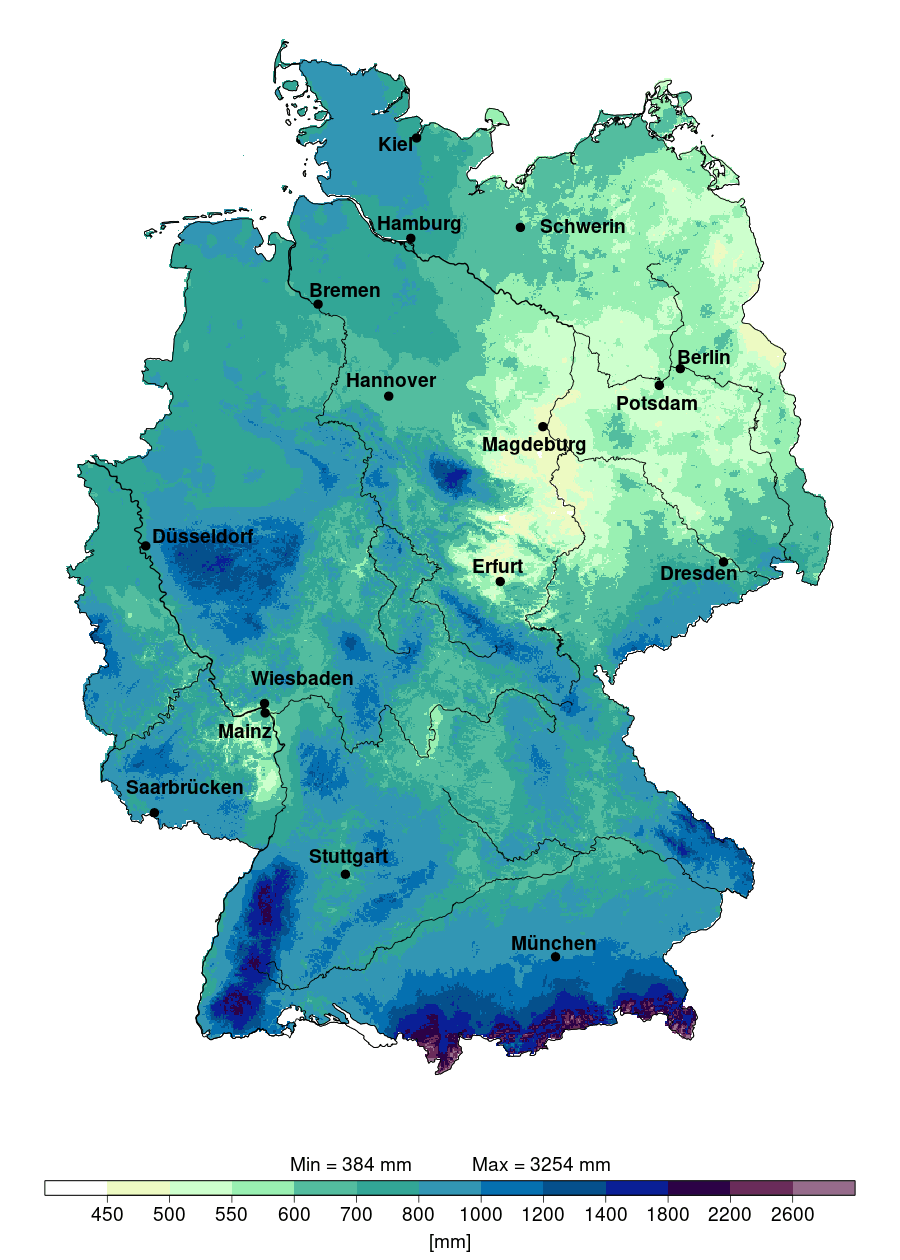
The real rain divide in Germany isn’t north vs. south — it’s west vs. east. The Rhine corridor and the hills behind it catch Atlantic moisture. The eastern lowlands (Halle, Erfurt, Magdeburg, Berlin) are borderline dry, with Halle averaging just 92 rain days. The DWD’s own climate atlas shows this gradient clearly — annual precipitation averaged over 1971–2000 paints a picture of a wet west and a dry east:
Frankfurt? Stuck in the middle. Average. Unremarkable.
So what happened to me?
Here’s the thing: I didn’t arrive in an average year.
The long-term average for Frankfurt is 109.5 rain days (1991–2022). In 2023, my first year, the station recorded 129 rain days — the 94th percentile. In 2024 it was 123 days — the 91st percentile. Both years were among the wettest since records began at the Westend station in 1985.
And 2026? Through early March, Frankfurt is already on pace for around 133 rain days if the current rate holds. That would be the wettest year in the dataset.
I didn’t move to a rainy city. I moved to a city during a rainy stretch.
Same rain, different heat
Look at how the 34 cities compare on temperature vs. rain intensity (millimeters per rain day). Frankfurt and Leipzig get rained on equally hard — about 5.9 and 5.6 mm per rain day respectively. But Frankfurt is 1.3°C warmer on average. That’s the gap that matters: same rain, more heat, more muggy summers. The Rhein-Main basin traps warmth. When it rains here, it’s after a humid buildup — thunderstorms that feel subtropical even when the numbers say “average.”
What I actually learned
The data tells a clear story: Frankfurt is a middling German city when it comes to rain. Not dry, not wet, just average. My perception was shaped by two things: bad timing (arriving during the 90th-percentile years of 2023–2024) and a biased baseline (six years in dry Leipzig during dry years).
The real rain cities in Germany are in the Ruhrgebiet and along the North Sea coast. If you want to complain about rain, move to Wuppertal.
Data · DWD Climate Data Center, daily KL records for 34 German cities, 1991–2024. Frankfurt station: Frankfurt/Main-Westend (01424), 2.0 km from city center. 2026 figures are partial-year projections based on data through early March.
Inspiration · Datawrapper’s sunshine in Berlin vs. Europe.
Map source · DWD Klimaatlas, average annual precipitation 1971–2000.